
Avoid fraudsters online through due diligence when importing cars from Japan
Japanese vehicles industry is one of the biggest industries in the...
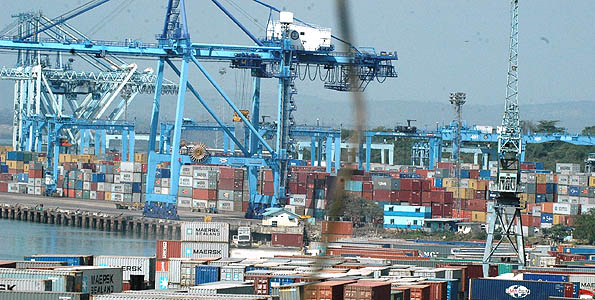
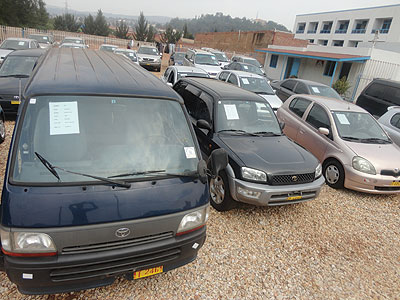
We have been able to get some interesting facts and figures about the exportation of used cars (only passenger vehicles alone) from Japan during the first half (January - June) of the year 2008. It should however be noted that these statistics do not include trucks and other commerical/non-passenger type vehicles.
Yeah thats right, it is well over three billion US Dollars!
RANK COUNTRY      | CAR UNITS | VALUE (JPY)
  1: RUSSIA       | 260,008   | 163,251,031,000
  2: CHILE        | 55,461    | 11,744,217,000
  3: UAE          | 37,167    | 9,321,093,000
  4: NEW ZEALAND  | 35,640    | 17,991,266,000
  5: MONGOLIA     | 14,322    | 4,342,595,000
  6: KENYA        | 13,013    | 7,342,810,000
  7: SOUTH AFRICA | 12,904    | 3,545,133,000
  8: SINGAPORE    | 12,894    | 21,078,435,000
  9: MALAYSIA     | 12,746    | 25,317,559,000
  10: BANGLADESH  | 10,208    | 10,706,168,000
Russia remains #1 way ahead of all other countries as Japan is supplying their used car market that is undergoing a rapid expansion. Others continue to remain strong, although the once leading importer, New Zealand has slowed down its imports since the new emission regulations have taken affect. Newcomers to the Top 10, Mongolia and Bangladesh, have seen recent sharp rises due to mostly political and somewhat economical changes. They’ve replaced Pakistan (19th) – which has gone through extreme political unrest, and United Kingdom (11th) which has seen reduced demand that is possibly related to economic downturn/unrest.
Together, the top 10 represent roughly 80% of the used passenger vehicles exported from Japan and 78% of the total value of the cars. Thus the top 10 importers hold a landslide majority of sales Japanese used car exporters have made.
Adding the next 10 (Top 20) would make it 90% of car units and 88.5% of total cash amount. Counting the top 50 together will make it roughly 99% of both car units sold and total value.
Draw you own conclusions. The data is quite clear, and if your an exporter, you should have a clear idea what to do. If you want to look at the full data, you can do so by going to:
Japanese Used Passenger Car Export Statistics : January 2008 to June 2008
Note: Car Units and Value data for each country comes from Japan Customs Statistics Office. All other data is calculated by me. Percentages and VPUs are rounded to simplify view.

Japanese vehicles industry is one of the biggest industries in the...

One person was Sunday at dawn killed and more than 50 wounded in...
Nairobi residents are getting ready for a road revolution of...

R.D.T.F: Rules / Regulations, Duty, Tax, Facts, these are the four...